Inside Blinkit’s Fresh Basket: A 3-Day Data-Driven Analysis of Prices, Stock, and Strategy
- Aarathi J
- Jul 23, 2025
- 6 min read

Updated: Nov 19, 2025

Introduction
In the hyper-competitive world of online groceries, where minutes matter and freshness drives loyalty, Blinkit has carved out a space by delivering essentials at lightning speed. But beyond the sleek UI and express delivery promise, what’s happening behind the curtain in terms of pricing, stock levels, and category strategy?
To find out, we analyzed a compact yet powerful dataset: three consecutive days (March 17–19, 2025) of product data from Blinkit’s Fruits & Vegetables category. This time-series dataset includes over 1,100 data points, capturing fluctuations in sale prices, availability, and discounts across one of the most dynamic segments in grocery.
While three days might sound like a short time, the data tells a compelling story about stock movement, price strategy, and category balance. Let’s peel back the layers of Blinkit’s fresh shelf.
Section 1: Stock Availability – Blinkit’s Shelf Recovery in Action
Stock availability is at the heart of every grocery platform’s success. A “Sorry, out of stock” message on your daily essentials can be a deal-breaker for customers. Blinkit seems to understand this well.
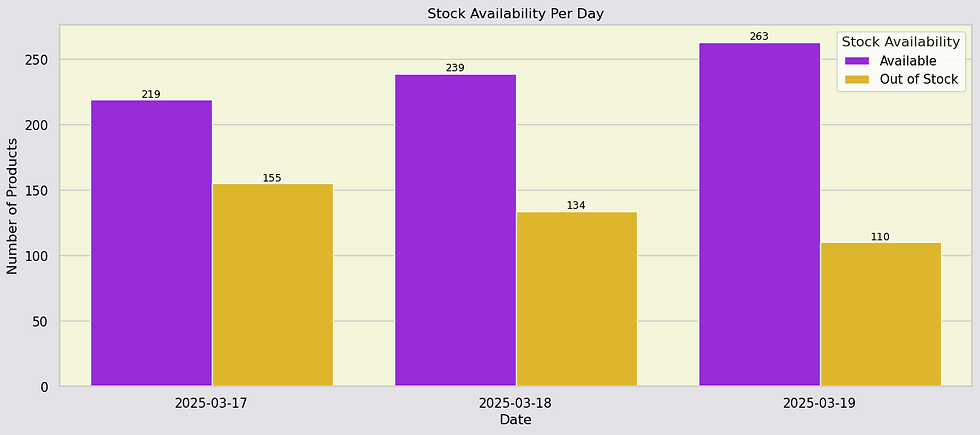
Key Takeaways:
March 17: 219 items were available, while 155 were out of stock.
March 18: Availability improved to 240, while out-of-stock items reduced to 124.
March 19: Highest availability at 263, with only 110 out-of-stock—nearly a 30% improvement in availability over 3 days.
What This Suggests:
Blinkit rapidly recovered inventory, possibly through real-time restocking or backend optimization.
The increasing stock trend and decreasing out-of-stock count over just three days reflect a responsive supply chain.
March 19 marked the best day in terms of inventory health, highlighting the platform’s ability to adjust quickly to demand.
For quick-commerce, even short outages can cause frustration. This data suggests Blinkit is not only aware of it but is actively countering inventory gaps with agile restocking processes.
Section 2: Blinkit’s Price Movement – A Micro-Trend with Macro Implications
Price fluctuations in fresh produce are expected. But even within a tight 3-day window, Blinkit displayed noticeable price volatility—especially in sale prices.
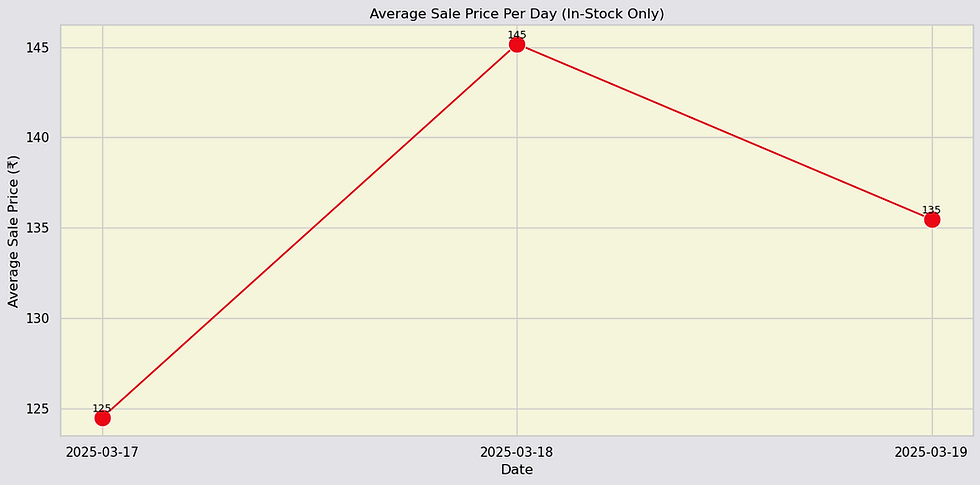
Key Takeaways:
On March 17, the average sale price was ₹125.
On March 18, prices surged to ₹145 — a 16% jump.
On March 19, prices corrected to ₹135, slightly above the starting point.
Why This Matters:
A ₹20 increase in just 24 hours reflects supply constraints, demand surges, or the restocking of higher-value items.
The minor drop on Day 3 suggests that while availability improved, Blinkit maintained a higher pricing tier—perhaps signaling a shift in product mix (e.g., premium fruits or organic vegetables).
Despite restocking more items, Blinkit didn't drop prices aggressively, which might indicate limited price elasticity or confident pricing.
This shows how Blinkit’s pricing algorithm may respond to short-term supply shifts, and that customers might want to time their purchases accordingly.
Section 3: Discounts in Action – Transparent and Reliable
How do listed prices compare to what shoppers actually pay? A look at Blinkit’s discount behavior across three days reveals a consistent markdown strategy.

Key Takeaways:
Sale prices were consistently lower than original listed prices.
This discount trend was present across all product tiers, not just for premium SKUs.
While original prices had a wider spread (especially March 18 and 19), sale prices remained in a tighter band—signaling controlled and even discounts.
What This Means:
Blinkit applies price drops broadly rather than selectively, helping create trust in the platform’s pricing.
The consistent markdown behavior over three days suggests there was no flash discounting or sudden price wars—just a steady, shopper-friendly strategy.
For price-sensitive buyers, this reliability matters. You don’t have to chase deals—they’re already baked in.
It’s a well-balanced pricing model that rewards both volume and loyalty without relying on gimmicky discounts.
Section 4: Fruits vs Vegetables – Inventory Imbalance and Strategic Prioritization
Fruits and vegetables may share shelf space, but Blinkit doesn’t treat them equally—and neither does the supply chain.

Key Takeaways:
Fruits consistently had higher in-stock numbers than vegetables.
On March 18, the gap widened to 160 fruits vs. 79 vegetables.
Vegetables dipped sharply on Day 2, recovering mildly on Day 3 (96 in stock).
Fruits showed continuous growth in availability, from 119 → 160 → 167.
Interpretation:
Fruits may be prioritized due to higher shelf life, better procurement channels, or greater demand predictability.
Vegetables, likely sourced more locally and perishable, showed instability—possibly hinting at restocking or sourcing issues.
March 18’s vegetable dip could also be due to a sales spike rather than a supply issue.
Blinkit’s apparent emphasis on keeping fruits consistently stocked may point to revenue optimization—especially when we compare pricing next.
Section 5: Price Disparity – Fruits Bring Margin, Veggies Drive Volume
Fresh produce isn’t just about freshness—it’s about margins and basket economics. And Blinkit’s data shows fruits dominate revenue potential.

Key Takeaways:
Fruits were priced 4–5 times higher than vegetables across all three days.
Fruits: ₹189–₹198 range
Vegetables: ₹38–₹45 range
March 18 was pivotal:
Fruits hit their highest average price (₹198)
Vegetables hit their lowest (₹38)
Strategic Implications:
Fruits, likely including exotic and seasonal varieties, fetch better margins per unit.
Vegetables, though lower-priced, may be Blinkit’s footfall driver—offering affordable essentials to keep daily users engaged.
This pricing duality supports a “high-margin + high-volume” revenue model.
For Blinkit, this means balancing stock and pricing carefully. For shoppers, it suggests that premium fruits are driving up your cart totals—while veggies help balance your budget.
Conclusion: 3 Days, 1 Clear Story
Despite the short window, Blinkit’s fresh produce data reveals sharp insights into the operational heartbeat of an online grocery app:
Stock availability improved visibly over 3 days.
Prices shifted dynamically, with a clear midweek peak.
Discounts were broad, consistent, and reliable.
Fruits led in availability and pricing, while vegetables lagged slightly in stock but offered affordability.
Fruits = Margin, Vegetables = Volume—a balanced playbook for grocery success.
For consumers, the takeaway is clear: shopping on Blinkit means predictable savings, but basket totals can swing depending on the day and product mix.For businesses? It’s a case study in responsive inventory management, consistent discounting, and revenue optimization through strategic category focus.
Data used for this analysis has been extracted using web scraping from the Blinkit website, cleaned and enriched using different techniques. Contact us to access the complete web scraped data from Blinkit.
Connect with Datahut for top-notch web scraping services that bring you the information you need, hassle-free.
Frequently Asked Questions (FAQs)
1. How was the Blinkit data collected for this analysis?
The data used in this analysis was collected using web scraping techniques, specifically tailored for e-commerce platforms like Blinkit. We used a Python-based scraper that tracked fresh produce listings over a 3-day window.
For more technical guidance on building your own scraper, check out our tutorial: 👉 How to Scrape Blinkit Product Data Using Python
2. Why does Blinkit show such sharp price fluctuations in fruits and vegetables?
Blinkit operates in the quick-commerce space, which means inventory and prices can change rapidly due to supply chain dynamics, demand surges, and product mix changes (like premium fruits being stocked).
This pricing behavior is similar to what we’ve seen in other dynamic retail platforms—like in our blog on 👉 H&M’s Data-Driven Pricing Strategy and 👉 Zara’s Product Price Distribution.
3. Are Blinkit's discounts applied consistently across all products?
Yes, based on the violin plot visualization, our 3-day EDA shows that discounts are not exclusive to high-end items. Blinkit applies consistent markdowns across fruits and vegetables, making the sale price range narrower and more predictable.
You can explore a similar trend in our 👉 Office Depot Pricing Analysis, where discounts were strategically applied across SKUs.
4. What’s the difference between fruit and vegetable strategy on Blinkit?
Fruits generally had higher availability and were priced 4–5x more than vegetables during the 3-day period. This suggests a margin-maximizing approach for fruits and a volume-driven approach for vegetables.
This mirrors inventory strategies discussed in other product-focused analyses, such as 👉 Our Smart Home Trends EDA at Lowe’s, where high-margin and high-volume categories were handled differently.
For more on category behavior, see the full Blinkit analysis above or check Blinkit’s product lineup on their official website.
5. How can businesses use this Blinkit EDA for competitive advantage?
If you're running an online grocery, retail tech startup, or supply chain business, you can use short-window time-series data (like Blinkit’s) to make decisions on pricing optimization, discount models, and real-time inventory restocking.
Learn more about scraping competitor prices in this guide: 👉 Free Web Scraping Workflow for Competitor Price Tracking And if you're new to scraping altogether, start here: 👉 What Is Web Scraping & Why It Matters for E-commerce


