California vs New York Condo Prices 2025: Homes.com Data Insights
- Anusha P O
- Nov 9, 2025
- 10 min read

Updated: Nov 12, 2025
Buying a home—be it a house, condo, or co-op—in California or New York is not just a choice of location, but a high-stakes financial decision. At Datahut, we scraped over 1,400 real estate listings from Homes to analyze how these two iconic states compare specifically in the condo and apartment market. This Exploratory Data Analysis (EDA) reveals that from median purchase price and property taxes to the value per square foot and the cost of larger units, California's housing market is significantly more expensive than New York's, revealing stark coast-to-coast differences in affordability and long-term ownership burdens
At Datahut, we scraped real estate listings from Homes to analyze how these two iconic housing markets compare. From median home prices to tax burdens and square footage value, this study reveals exactly how—and why—the cost of home ownership differs coast to coast.
In this Exploratory Data Analysis (EDA), we dive into two sets of real estate listings scraped from Homes, focusing on California and New York—two of the most dynamic housing markets in the United States. Each dataset contains 700 property records, offering a balanced sample for meaningful comparison.
The goal of this analysis is to explore, compare, and visualize housing trends across these two states—examining factors such as price distribution, property size, number of bedrooms and bathrooms, and location-based patterns etc. By leveraging Plotly, an interactive visualization library, we aim to uncover insights that highlight how the real estate landscapes of California and New York differ in affordability, property features, and overall market composition.
Want full raw data for your own analysis?
Click here to view all the data (California , New York)
Homes Data Insights- Median Condo Prices:
Coast-to-Coast Comparison
Thinking of buying a condo in the U.S.? One of the biggest decisions for home-buyers and real estate investors is choosing the right state — especially when comparing top markets like California vs. New York. Condo prices in the United States vary widely based on location, demand, property size, and market trends.
In this data-driven real estate analysis, we break down median condo prices, affordability, and investment potential between California and New York — two of the most competitive U.S. housing markets. Whether you're a first-time buyer, property investor, or market analyst, this side-by-side comparison offers actionable insights backed by real scraped data from Homes.

This bar chart displays the median condo prices for two states — California and New York. Each bar represents the average price of condos in that state based on the data collected.
The blue bar represents California.
The orange bar represents New York.
The values above each bar show the exact median condo price in dollars.
Key Insights
California has a much higher median condo price at $1,195,000.
New York’s median condo price is about $599,800, which is almost half of California’s.
This difference highlights how location and demand play a major role in real estate pricing.
The data suggests that the California condo market is significantly more expensive — likely due to high demand, limited supply, and popular cities like Los Angeles, San Francisco, and San Diego.
In contrast, New York State’s overall condo prices are more moderate, despite New York City having its own high-cost real estate areas.
California continues to rank among the most expensive U.S. real estate markets, with condo prices and property taxes significantly higher than in New York. While New York is still considered a high-cost state, it offers comparatively better affordability, especially for buyers prioritizing value per square foot and lower annual property tax burdens.
Exploring Condo Price Distributions Across States
This section of the analysis explores the distribution of Condo prices in both locations.

This histogram compares how condo prices are distributed in California (red bars) and New York (green bars).
The horizontal axis (x-axis) shows the price of homes in dollars.
The vertical axis (y-axis) represents the number of properties that fall within each price range (count).
Both distributions are plotted on the same graph, allowing us to see where prices overlap and where they differ.
This type of plot helps reveal whether most condos are clustered around a certain price range or if there are many properties in higher or lower ranges.
Key Insights
Majority of condos in both states fall within the lower price brackets (under $5 million). This suggests that while luxury condos exist, most listings are in more affordable ranges.
New York shows a tighter cluster of prices, meaning condo prices are more concentrated within a smaller range. Most properties fall below $10 million.
California’s distribution is more spread out, indicating that while many condos are in lower price ranges, there are also a noticeable number of high-value properties extending well above $10 million.
The long “tail” seen in California’s distribution shows the presence of ultra-luxury properties, going as high as $50 million in some areas.
New York’s count is higher in the lower range, but the presence of extremely high-priced condos is less frequent compared to California.
The condo price distribution clearly highlights how different the California and New York housing markets truly are.
California shows a wider price range, especially in the luxury segment, indicating strong demand for high-end condos in cities like Los Angeles, San Francisco, and San Diego.
New York displays tighter price clustering, suggesting a more stable and mature condo market with fewer extreme price spikes outside premium NYC districts.
These findings provide valuable real estate insights for buyers, investors, and analysts aiming to understand state-wise property trends and identify opportunities in the U.S. condo market.
Understanding Condo Value Through Square Footage
In this section, we examine how the size of condos (measured in square footage) influences the median price across two of the most competitive real estate markets in the U.S.

The bar chart compares the median condo prices for the top five most common square footage ranges (Sqft) in California and New York.
The x-axis shows the square footage (condo size).
The y-axis represents the median condo price in dollars.
Each pair of bars compares the same condo size between the two states.
Teal bars represent California, and purple bars represent New York.
This visualization helps us understand whether larger condos always lead to higher prices — and how those price patterns differ between the two states.
Key Insights
For most condo sizes, California condos are priced higher than condos in New York, even when the square footage is similar.
Around 780–800 sqft, both states show high prices, but California’s prices are still slightly higher — reflecting the state’s overall higher cost of housing.
The largest gap appears around 670–750 sqft, where California’s median price exceeds New York’s by a noticeable margin.
Interestingly, New York shows some high-priced outliers (for example, at ~790 sqft), which might represent premium urban apartments, likely influenced by location (e.g., NYC metro areas).
Square footage alone doesn’t fully explain condo price differences — factors like neighborhood, demand, and amenities play major roles in these variations.
The California condo market consistently maintains higher median prices across nearly all common condo sizes. This reflects the state’s strong housing demand, limited property supply, and premium land values in cities such as Los Angeles, San Francisco, and San Diego. In contrast, New York condo prices show more variation — generally lower overall but with occasional spikes in high-value urban listings, particularly in Manhattan and nearby metro areas. Interestingly, the relationship between condo size and price isn’t always linear. Smaller condos in high-demand neighborhoods can cost more per square foot than larger units in less competitive areas. Overall, California demonstrates a stronger price premium per square foot, driven by factors such as limited housing supply, location desirability, and intense market competition in major real estate hubs.
How Much Do Homeowners Pay? Which State Has Higher Property Tax
This analysis focuses on understanding the median estimated annual property taxes in 2 states. The goal of this analysis is to compare how property taxes differ between these two states, giving potential homeowners or investors an idea of the cost of maintaining a home in each location.

This horizontal bar chart shows the median estimated annual property taxes for California and New York. Each bar represents the midpoint (median) value of property taxes estimated across the available condos in that state.
What the Chart Shows
The x-axis represents the Median Annual Taxes ($) — the average midpoint of yearly taxes homeowners are expected to pay.
The y-axis lists the States being compared — California and New York.
Each colored bar represents the tax amount for that state, and the exact value is displayed inside the bar.
Key Insights
California has a significantly higher median annual tax of $10,746.
New York, on the other hand, has a median annual tax of $5,352 — roughly half of California’s median tax value.
This large difference indicates that property ownership costs are higher in California, even though both states are known for high living expenses.
Factors that may contribute to this difference include property valuation methods, state tax policies, and regional housing market trends.
From this comparison, it’s clear that California homeowners pay much more in property taxes than those in New York, on average. For buyers considering relocation or investment, this kind of insight helps in budget planning and financial decision-making.
Do Larger Condos Mean Higher Monthly Payments? CA vs NY Cost Analysis
This analysis explores how estimated monthly condo payments vary with the number of bedrooms. The goal is to understand how affordability shifts as condo size increases in these two states, helping buyers or renters make more informed housing budget decisions.
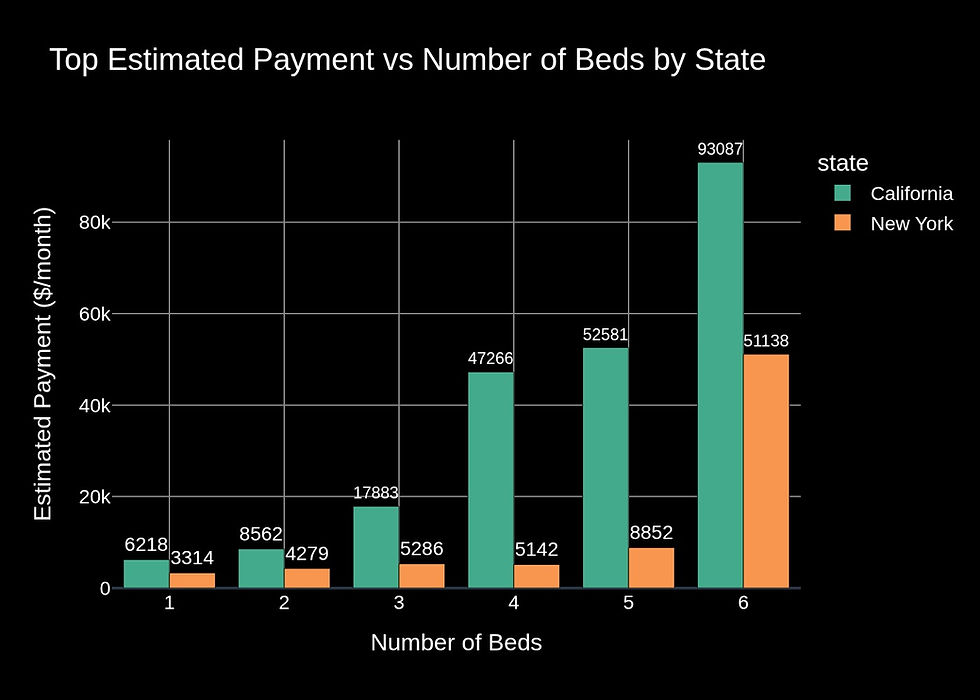
This bar chart compares the top estimated monthly payments for homes with different numbers of bedrooms. Each bar represents the highest estimated payment recorded for that specific number of bedrooms.
What the Chart Shows
The x-axis represents the number of bedrooms (from 1 to 6).
The y-axis represents the estimated payment per month ($) — the expected top monthly cost for properties with the given number of bedrooms.
The two colored bars represent California (green) and New York (orange).
Key Insights
For 1–2 bedroom homes, both states have relatively lower estimated payments, but California consistently shows slightly higher costs.
From 3 bedrooms onward, the payment gap widens significantly, with California’s payments rising much faster than New York’s.
The highest estimated payment is for 6-bedroom homes in California ($93,087/month), compared to New York’s $51,138/month — showing almost a double difference.
This pattern highlights how larger homes in California tend to be far more expensive, reflecting the state’s higher real estate prices and luxury housing demand.
Overall, as the number of bedrooms increases, both states see higher costs, but California’s growth rate is much steeper, suggesting premium property markets and higher valuation per square foot.
This analysis highlights a clear trend in the U.S. housing market — the cost of living and home-ownership expenses rise much faster in the California housing market compared to New York real estate as property size increases. For home-buyers and real estate investors looking into larger condos or multi-bedroom homes, California property prices demand a significantly higher budget. In contrast, New York housing prices show a more gradual and moderate increase in overall costs as the number of bedrooms expands, offering relatively better value for larger living spaces.
How Condo Age Impacts Price per Square Foot
This analysis explores the relationship between the year a home was built and its price per square foot. The purpose of this analysis is to understand how property age affects pricing trends in each state, and whether newer homes are priced higher or lower per square foot compared to older ones.

This scatter plot visualizes how home prices per square foot vary depending on when the homes were built. Each dot represents a property listing from California or New York.
What the Chart Shows
The x-axis represents the Year Built, showing how old or new each property is.
The y-axis represents the Price per Square Foot ($) — how much one square foot of property costs.
Each colored dot shows a property in either California (red) or New York (green).
Key Insights
California properties generally have higher prices per square foot than those in New York, regardless of the construction year.
Many of the older homes (built before 1950) show a wide variation in prices, which could be due to location, renovation quality, or historic value.
Recently built homes (after 2000) tend to have higher prices per square foot, especially in California — suggesting that modern constructions command a premium.
In New York, most homes cluster between $1,000–$3,000 per sqft, indicating more price stability across different build years.
The scattered high-price points in California show that certain luxury or high-demand areas push property values sharply upward.
This real estate analysis shows that newer condos cost more per square foot, driven by demand for modern amenities and updated infrastructure. However, California condos remain significantly pricier than New York, highlighting the impact of location-driven market value. Pricing is shaped by more than home age — key factors include state-wise housing demand, urban development, and local market trends. These insights help home buyers, real estate investors, and market analysts compare long-term value and make data-informed decisions in the U.S. condo market.
Want similar data-driven real estate insights?
Get in touch with Datahut to extract, analyze, and visualize property data from any real estate platform — effortlessly.
FAQs
1. How were the California and New York condo prices analyzed in this study?
The condo prices were analyzed using data scraped from Homes listings. This included property prices, square footage, location, and amenities. Tools like Datahut’s real estate web scraping solutions help automate this process to generate reliable and large-scale datasets.
2. Why do condo prices differ so much between California and New York?
Price variations are influenced by several factors like demand, location desirability, property taxes, and income levels. California’s coastal cities and New York’s Manhattan region both attract premium buyers, but local regulations and housing supply create distinct pricing patterns.
3. Can real estate businesses use web scraping to track price trends like these?Absolutely. With ethical and compliant real estate data scraping, businesses can monitor pricing fluctuations, inventory changes, and buyer demand. Datahut offers scalable scraping solutions that transform raw listing data into actionable market insights.
4. Is the data from Homes reliable for market analysis?
Yes, Homes is a reputable source for property listings. However, to ensure accurate insights, it’s crucial to clean, validate, and analyze the scraped data — a process that Datahut specializes in through its end-to-end data extraction and analysis services.
5. How can I get similar data for my real estate business?
You can request a custom data scraping project with Datahut. Whether you need condo prices, rental trends, or agent data, Datahut can collect and structure real-time property information from major listing sites to support data-driven decision-making.