


Two brands can sell products in the same category at very different prices. One may appear to charge 25% more than the other. But does that mean it has a higher brand price premium?
Not necessarily.
The more expensive brand might sell larger packs, use better materials, offer more features, or carry more products in the premium segment. Comparing the average price of each brand's entire catalogue won't tell you how much of the difference comes from the brand itself.
A fair comparison starts with products that serve the same purpose and have similar specifications. Once those products are matched, you can calculate the price difference, measure the premium across a category, and see where one brand consistently charges more than another.
This approach gives e-commerce teams a practical way to measure brand price premium, benchmark competitors, and make pricing decisions using product-level data.
What is brand price premium?
Brand price premium is the percentage by which a brand's price exceeds the price of a comparable product or a chosen benchmark.
For example, if Brand A sells a product for $120 and a comparable product from Brand B costs $100, Brand A has a 20% price premium over Brand B.
That difference describes the price relationship between the two products. It does not, by itself, prove that customers value Brand A more or that its brand equity is stronger. Product quality, specifications, distribution, promotions, and customer demand can all affect the price.
For a broader explanation of the metric and its benchmarks, see Price Premium Index from Marketing Study Guide.
For e-commerce analysis, the first task is to establish a fair comparison. The calculation comes after that.
Why average product prices can give the wrong answer?
Imagine two brands selling products in the same category:
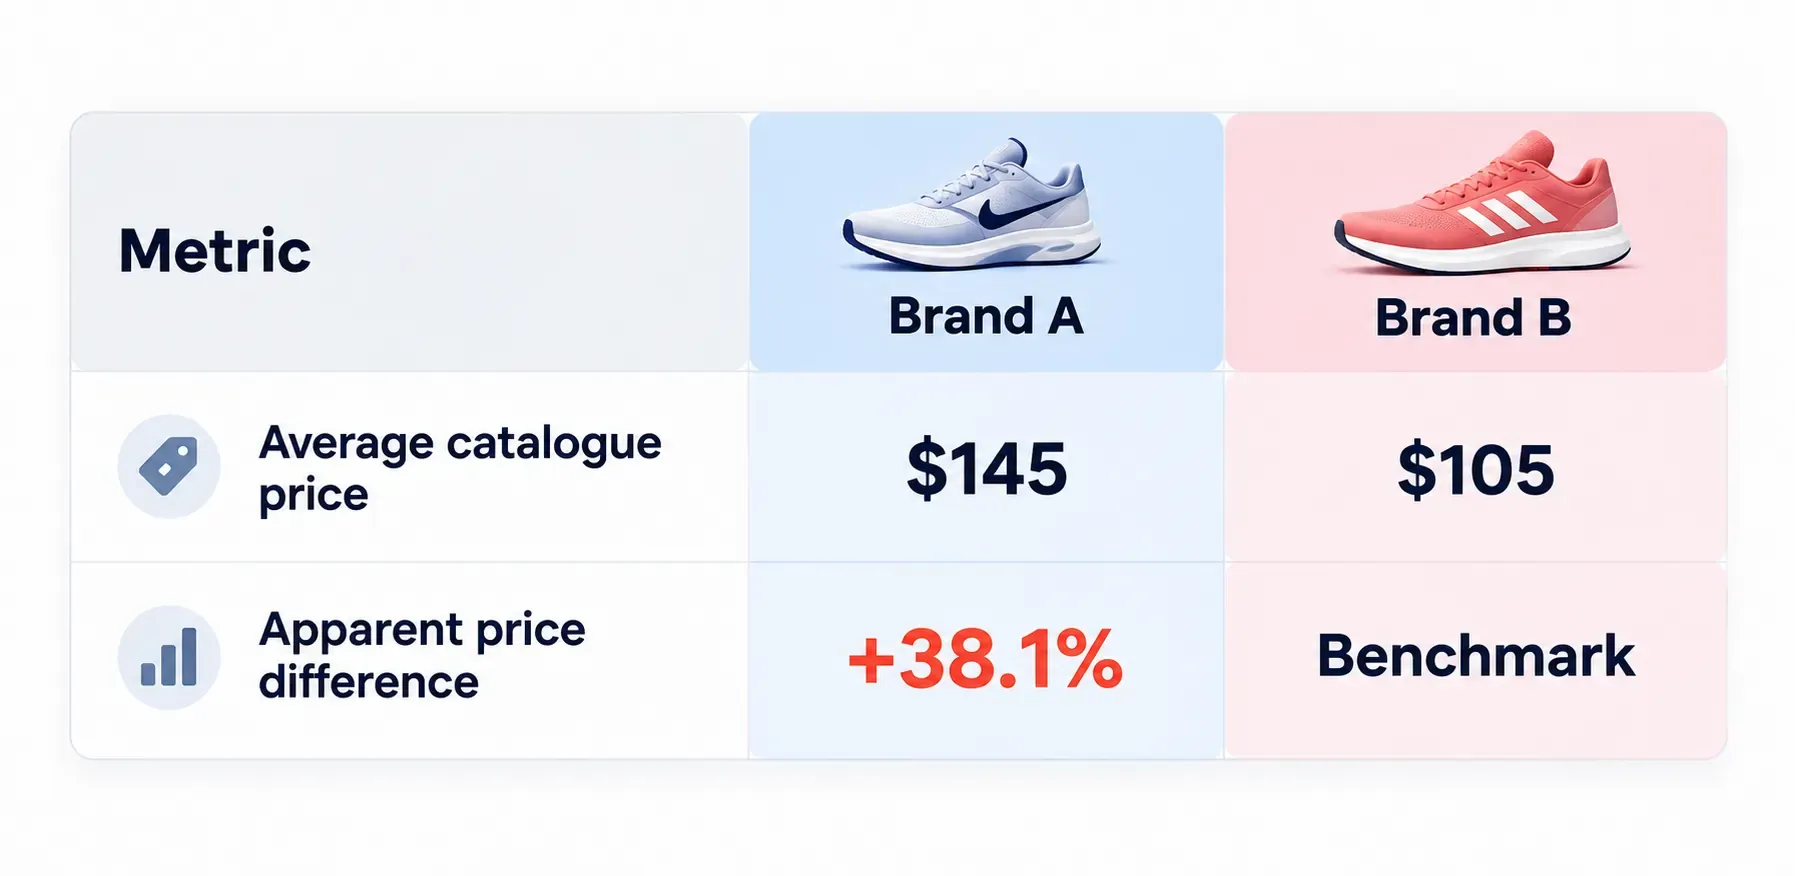
Based on average catalogue prices, Brand A appears to be 38.1% more expensive.
But suppose Brand A sells more premium models, while Brand B has a larger range of entry-level products. The average price difference could reflect their product mix rather than a premium for comparable products.
This is a common problem in competitive price benchmarking. Catalogue averages combine products with different sizes, specifications, features, and price points. They can help you understand the overall range, but they cannot establish a like-for-like brand price premium.
Compare equivalent products first. Then measure the difference.
What counts as a matched e-commerce product?
Matched products are products from different sellers or brands that are sufficiently similar to support a fair price comparison.
The right level of matching depends on the category. A match for a smartphone needs different attributes from a match for skincare or footwear.
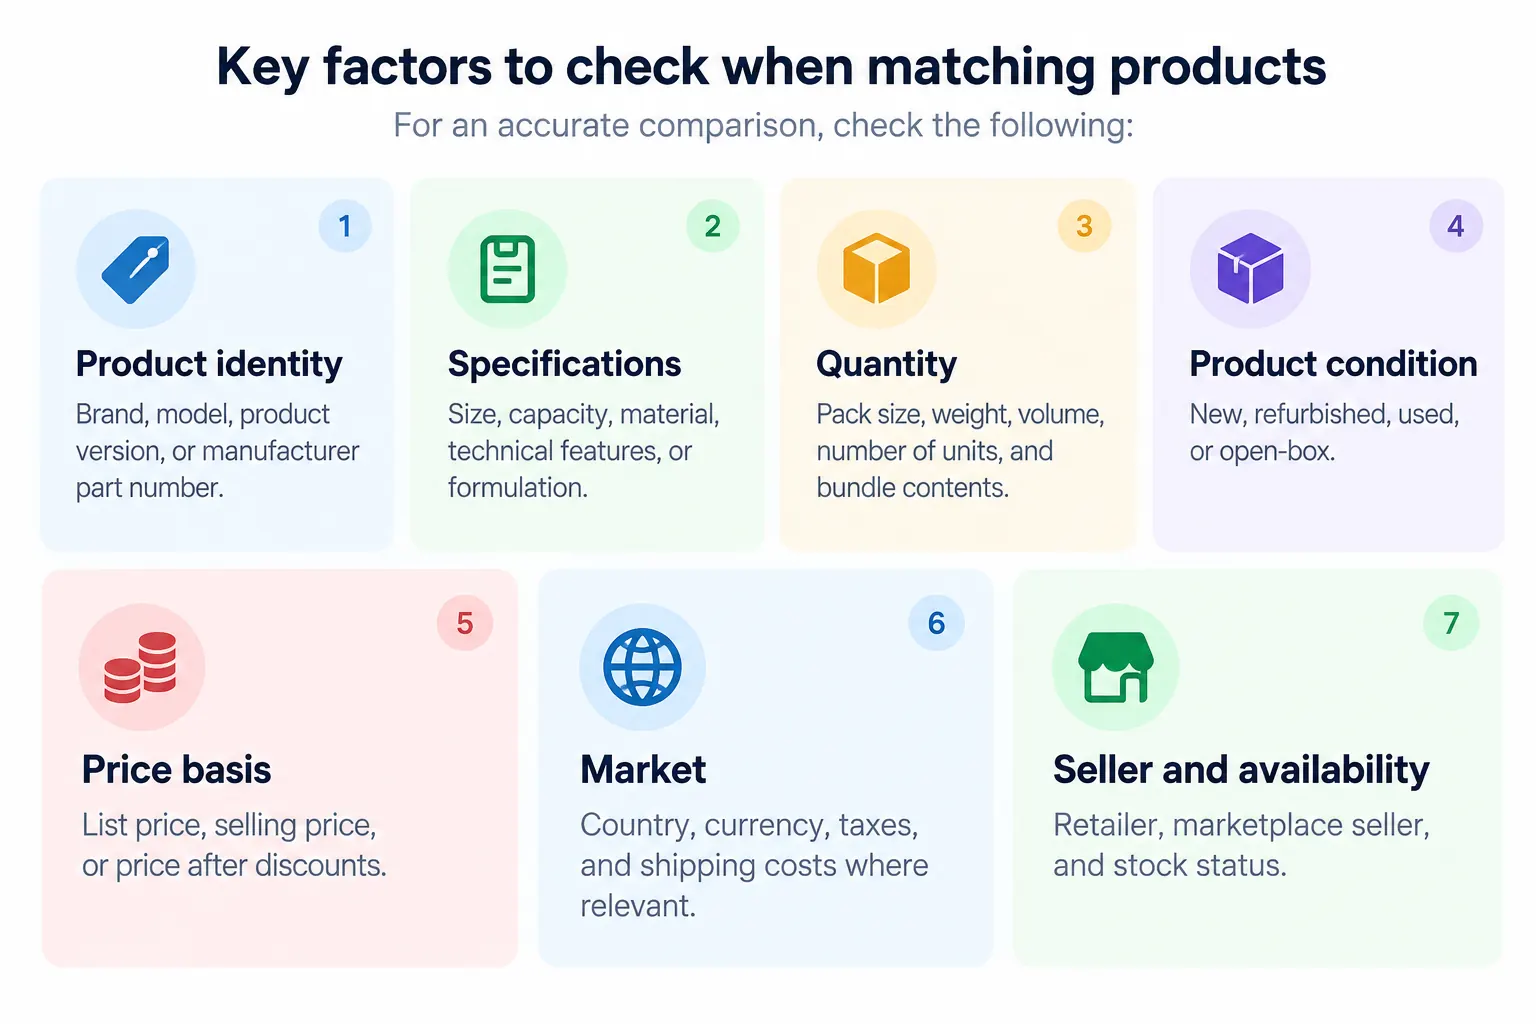
For an accurate comparison, check the following:
- Product identity: Brand, model, product version, or manufacturer part number.
- Specifications: Size, capacity, material, technical features, or formulation.
- Quantity: Pack size, weight, volume, number of units, and bundle contents.
- Product condition: New, refurbished, used, or open-box.
- Price basis: List price, selling price, or price after discounts.
- Market: Country, currency, taxes, and shipping costs where relevant.
- Seller and availability: Retailer, marketplace seller, and stock status.
An exact product match is preferable when both listings describe the same model or item. When exact matches are unavailable, a comparable-product match may work, provided the products serve the same purpose and have similar specifications.
Keep exact matches and comparable matches separate in your analysis. Otherwise, differences in product attributes can distort the result.
For the technical side of this task, read Datahut's guide to product matching for e-commerce data. It covers product listing differences and matching methods that help identify the same item across online stores.
Normalize prices before comparing products
Products may have different pack sizes or quantities even when they belong to the same category. In those cases, compare unit prices rather than headline prices.
Unit price formula:
Unit price = Total product price ÷ Quantity
For example, a 500 ml product priced at $10 costs $2 per 100 ml. A 750 ml product priced at $13.50 costs $1.80 per 100 ml.
The second product has a lower unit price, even though its total price is higher. Comparing headline prices alone would miss that difference.
Use a consistent price basis across the dataset. If one brand's discounted selling price is compared with another brand's regular list price, the resulting premium will be misleading.
How to calculate brand price premium?
Once you have a set of matched products, the calculation is straightforward.
Price premium formula:
Price premium (%) = ((Brand A price − Benchmark price) ÷ Benchmark price) × 100
The benchmark might be a competing brand's price, a market reference price, or another clearly defined comparison point. State which benchmark you use so readers can interpret the result correctly.
For additional guidance on setting product prices and evaluating competitor prices, see Shopify's guide to pricing a product.
Example: Calculating the price premium for one product
Suppose Brand A sells a pair of shoes for $120, while the matched product from Brand B costs $100.
Price premium = (($120 − $100) ÷ $100) × 100
Price premium = 20%
Brand A is priced 20% above Brand B for this product.
A negative result means Brand A is cheaper than the benchmark. A result of 0% means both products have the same price.
Example: Comparing five matched products
The table below uses illustrative prices to show how the calculation works across a small matched-product dataset.
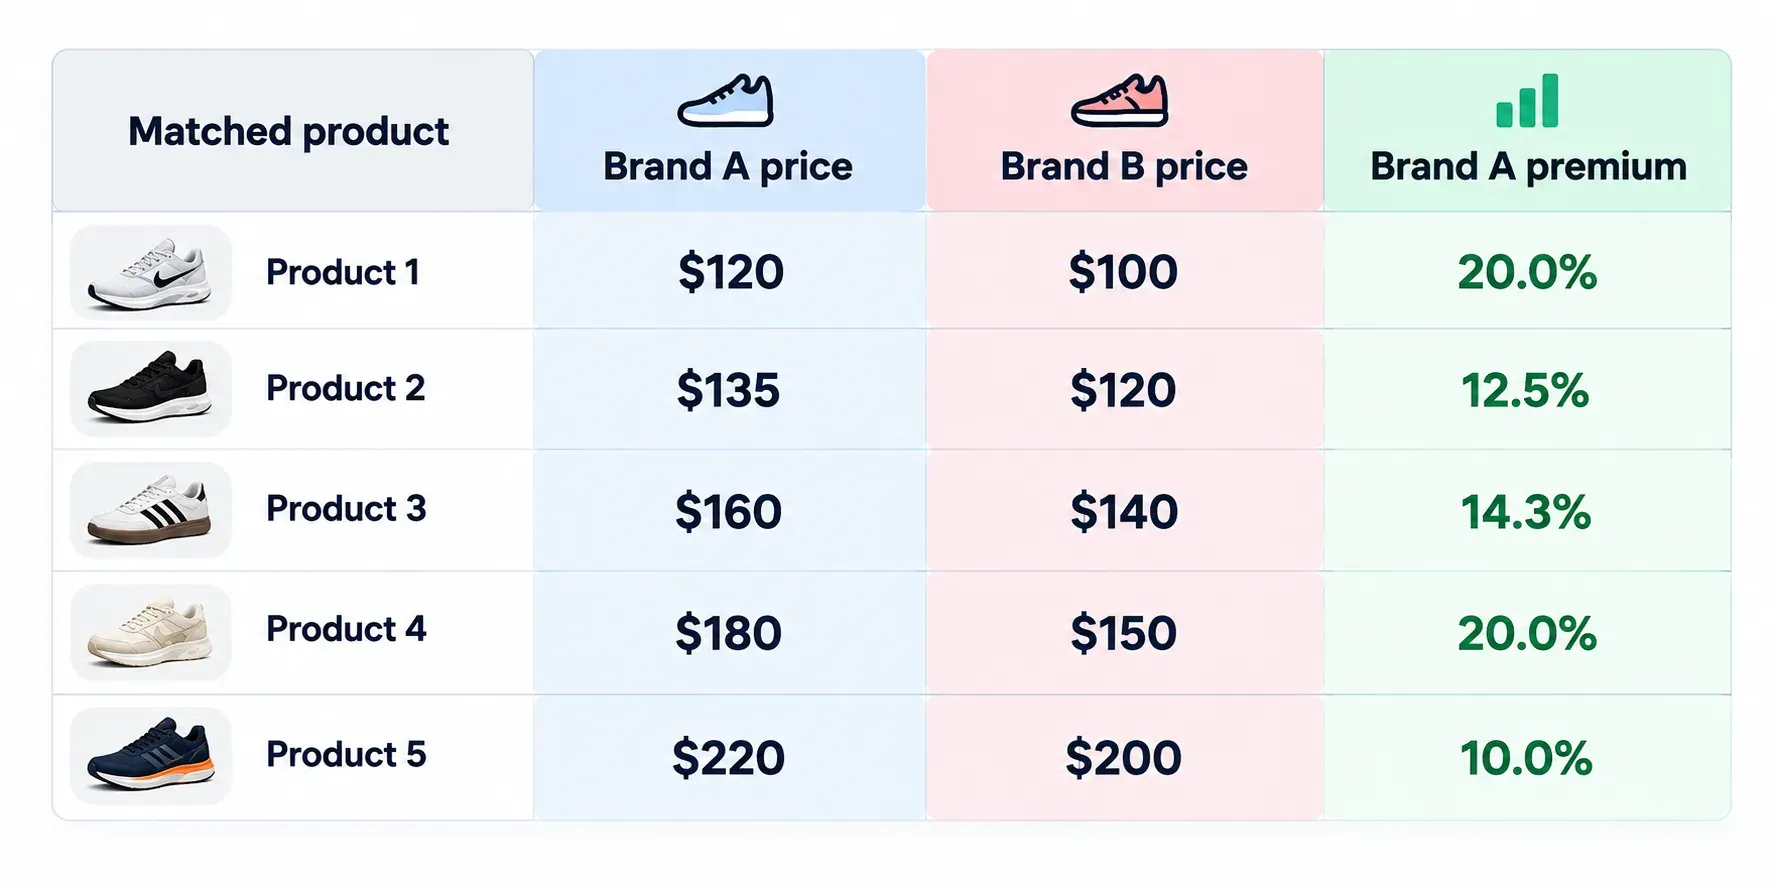
The average premium across these five products is approximately 15.4%, while the median is 14.3%.
The result gives you a product-level view of the price gap. It is more useful than comparing catalogue averages because each calculation uses a matched pair.
The sample is small, so it should not be treated as evidence of either brand's overall pricing position. A larger, representative set of matched products would provide a stronger basis for decisions.
Average premium vs median premium vs aggregate premium
There are several ways to summarize price differences across matched products. Each answers a slightly different question.
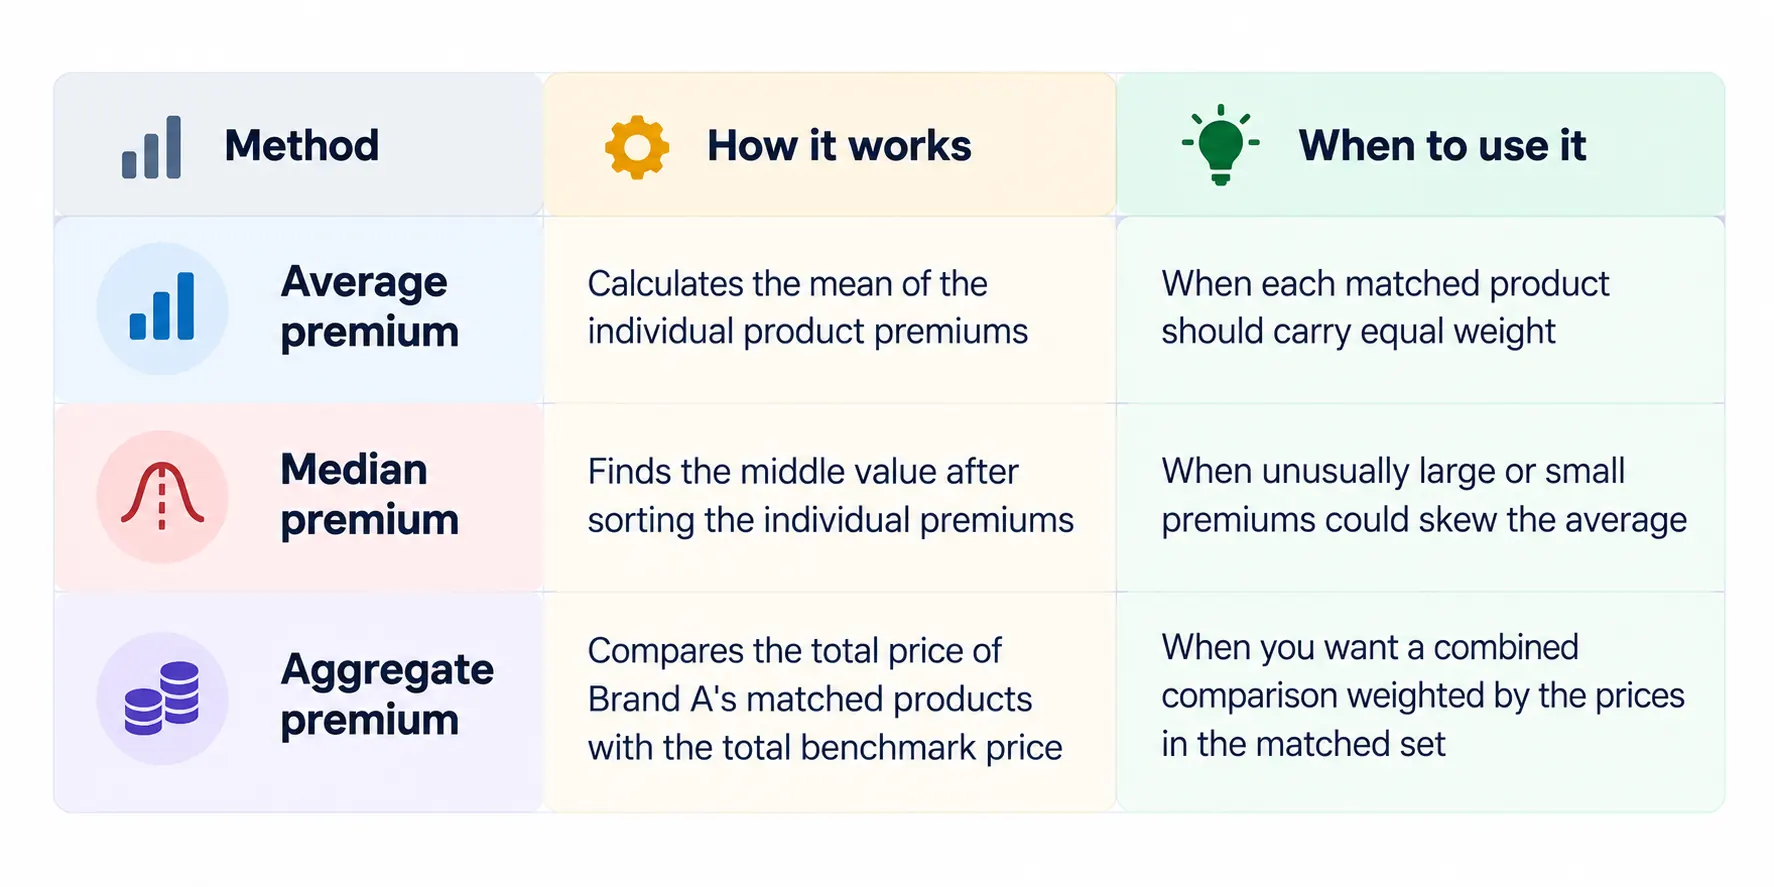
For most product-level brand price premium analysis, report both the average and median premium. The average shows the mean difference, while the median helps you see whether a few expensive products are pulling the result up or down.
Aggregate premium is different. It gives more influence to high-priced products because those prices contribute more to the total.
Be clear about which measure you report. An average of individual percentage differences is not the same as a percentage difference calculated from total prices.
How to separate brand premium from product-mix differences?
Matching products is the first step. You should also check whether other factors explain the price gap.
1. Compare products within the same category
A brand may charge more in one category and less in another. Combining all categories into a single number can hide these differences.
Calculate premiums separately for relevant product groups, such as running shoes, casual footwear, skincare, fragrance, or electronics.
For example, the table below shows an illustrative category-level analysis.
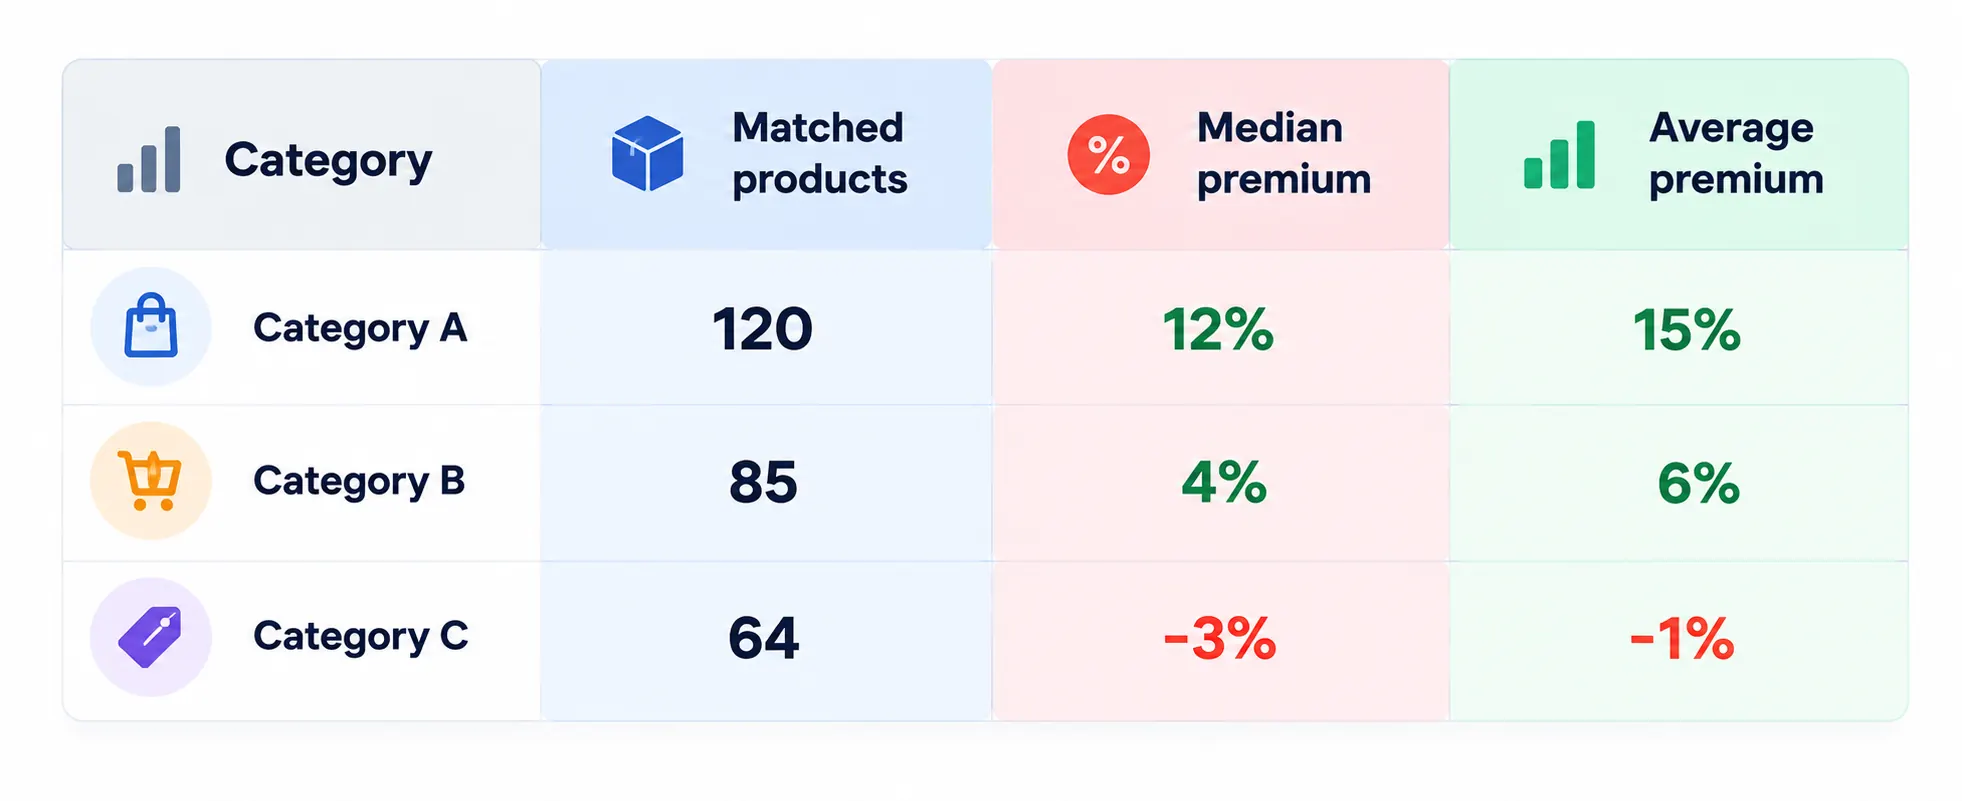
In this example, Brand A is priced above the benchmark in Categories A and B, but slightly below it in Category C.
That difference matters. A single catalogue-wide figure would not show where the brand charges more or where it competes on price.
To compare price movements at the category level over time, read Datahut's guide to building a category price index. A price index adds market context to product-level comparisons and helps distinguish isolated price changes from broader category trends.
2. Account for product specifications
A higher price may reflect a genuine difference in the product rather than a brand premium.
For example, a running shoe with a carbon plate should not automatically be matched with a basic training shoe just because both are listed under running footwear. A skincare product with a larger volume or a different active ingredient may also require a separate comparison.
Use the attributes that matter to the category, and exclude pairs that do not meet your matching criteria.
3. Separate list prices from selling prices
Promotions can change the apparent premium substantially.
Consider this example:
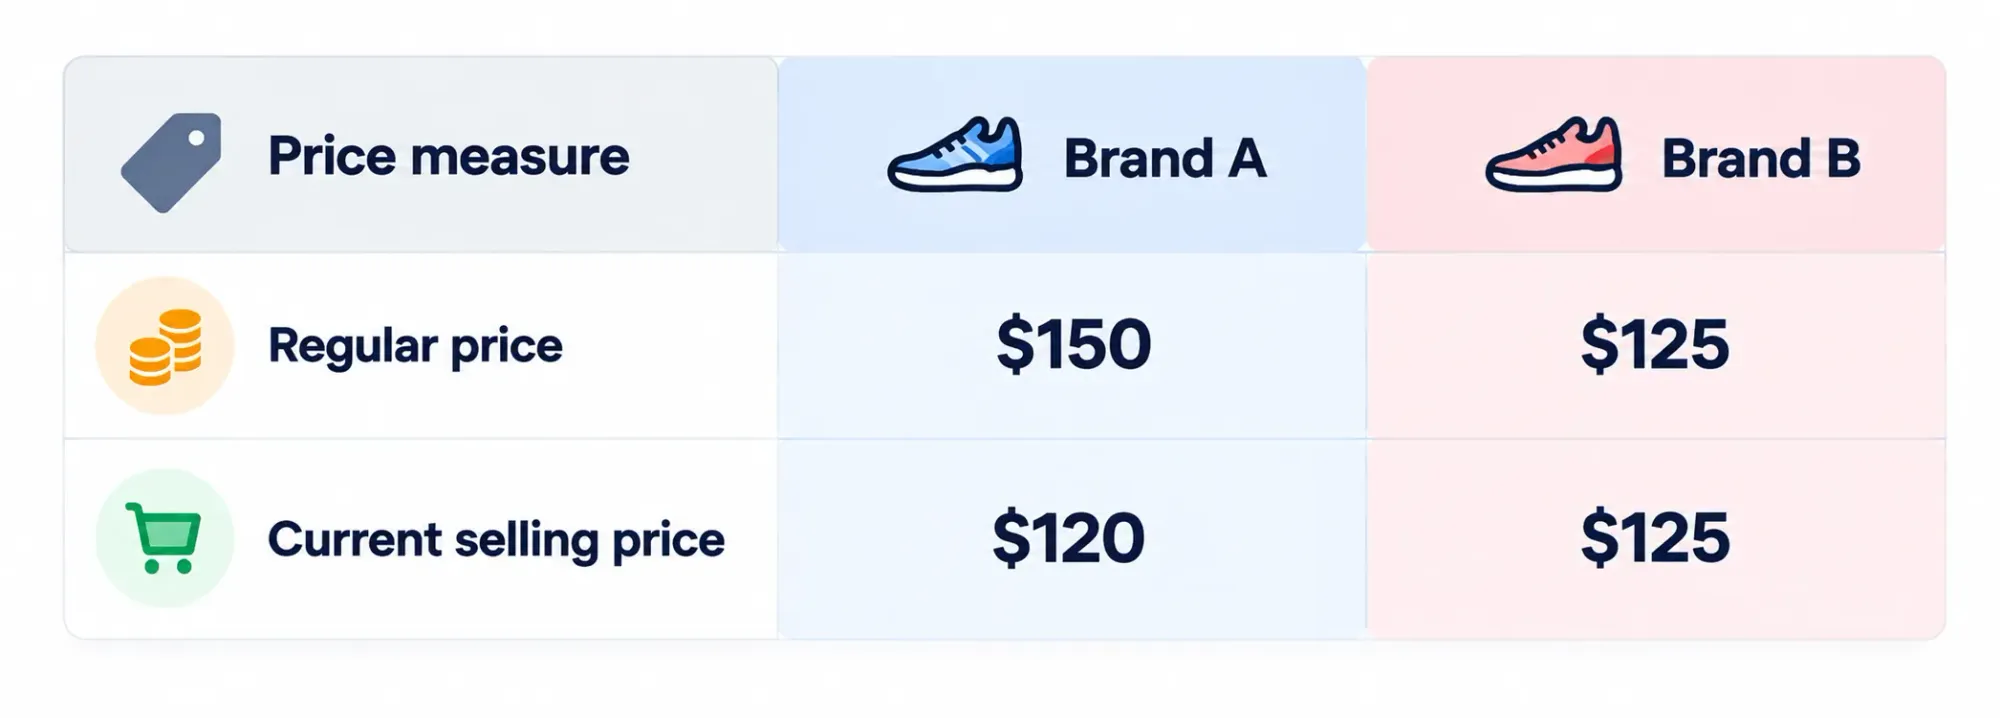
Using regular prices, Brand A has a 20% premium over Brand B.
Using current selling prices, Brand A is 4% cheaper.
Both calculations are correct, but they answer different questions. The first compares regular prices; the second compares the prices customers can currently pay.
For competitive pricing decisions, track both where the data is available. A brand may maintain a premium at list price while discounting heavily to compete in the market.
4. Keep geography and currency consistent
Prices can differ across countries because of taxes, exchange rates, shipping, local distribution, and market positioning.
Don't compare a product's Indian price directly with its US price and interpret the difference as a brand premium. Make the comparison within the same market whenever possible, or normalize the data and clearly document the method.
5. Check seller and stock differences
Marketplace listings may have different prices depending on the seller, stock status, delivery terms, or fulfilment method.
Decide in advance whether your benchmark uses the lowest available price, the price from a specified retailer, or a defined set of sellers. Apply that rule consistently across brands.
Out-of-stock products should not be treated as if customers can buy them at the displayed price. Record availability alongside pricing so the comparison reflects what is actually available.
How to measure price premium across a larger catalogue?
A five-product example explains the calculation. A working competitive pricing analysis may involve hundreds or thousands of listings.
For a larger dataset, use a repeatable pipeline:
- Collect product data. Gather product URLs, titles, brand names, specifications, list prices, selling prices, discounts, and availability from the selected retailers or marketplaces.
- Clean the data. Standardize currencies, units, product attributes, and price formats. Remove duplicate listings and flag missing or inconsistent values.
- Match comparable products. Use product identifiers and specifications to identify exact matches. Review uncertain matches before including them in the calculation.
- Calculate product-level premiums. Apply the same formula to every accepted product pair and retain the benchmark price used for each result.
- Group the results. Report average and median premiums by category, retailer, product type, or other useful segment.
- Monitor changes over time. Repeat the analysis to see whether premiums change as prices, discounts, and availability move.
A spreadsheet can handle a small dataset. Larger catalogues need consistent product matching and regular data collection; otherwise, the results become difficult to maintain and compare over time.
For the data collection and monitoring side, see Datahut's guide to competitor price monitoring using web scraping. It explains how to track competitor prices, product details, promotions, and availability over time.
Common mistakes in price premium analysis
Small errors in matching or price selection can change the result. Check for these issues before using the numbers to guide pricing decisions.
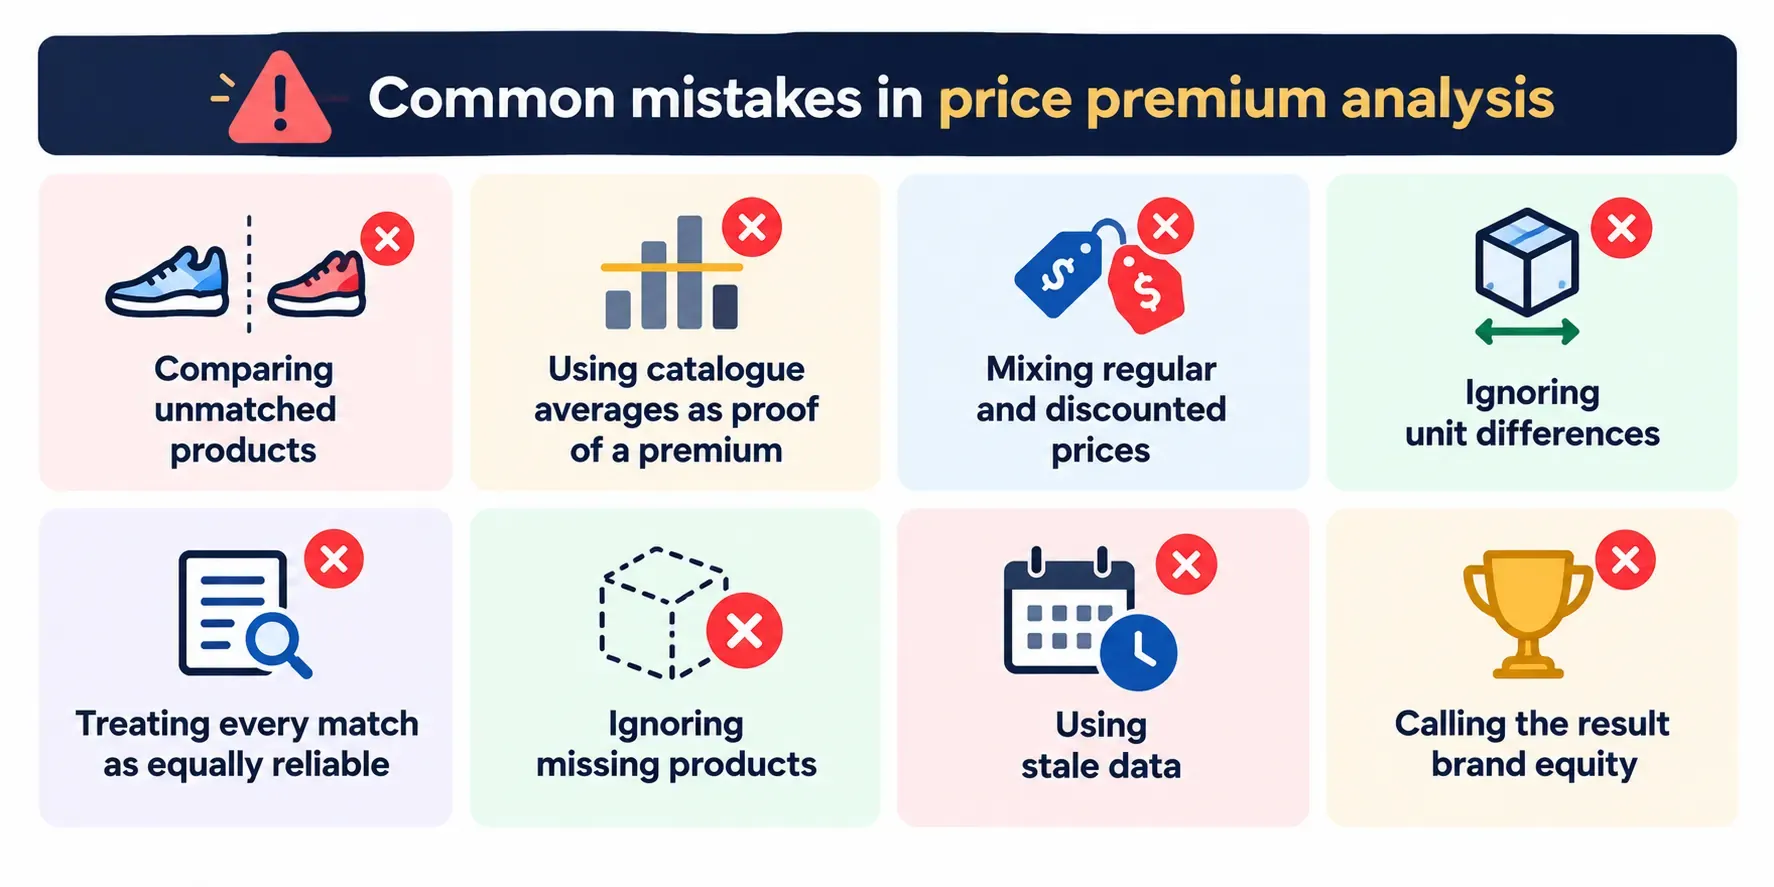
- Comparing unmatched products: Similar category labels don't guarantee equivalent products.
- Using catalogue averages as proof of a premium: Differences in assortment and product mix can distort the comparison.
- Mixing regular and discounted prices: Apply the same price basis to both brands.
- Ignoring unit differences: Normalize pack size, weight, volume, or quantity when necessary.
- Treating every match as equally reliable: Separate exact matches from approximate or attribute-based matches.
- Ignoring missing products: Unmatched listings can reveal gaps in assortment. They should not be silently treated as price matches.
- Using stale data: Competitor prices and stock levels change. Record when the data was collected.
- Calling the result brand equity: A price premium describes a price difference. It doesn't establish why customers pay it.
The last point is particularly important. Matched-product pricing can show that a brand consistently charges more for comparable products. To understand why, you need other evidence, such as customer research, reviews, product specifications, and sales performance. Research on factors influencing the price premiums consumers pay for national brands provides further context on the relationship between perceived quality and price premium.
What a high or low brand price premium tells you
A high premium means the brand is priced above the selected benchmark across the products included in the analysis. It doesn't automatically mean the brand is overpriced.
Check whether the premium appears across most categories or is concentrated in a few products. A consistent premium across comparable products may reflect a deliberate positioning strategy. A premium that appears only in one category may point to differences in product specifications, assortment, or competitive conditions.
A low or negative premium can indicate that the brand is priced close to, or below, the benchmark. That may support a value-oriented position, but it can also reflect a promotion or a short-term pricing decision.
Use the results to ask more specific questions:
- Which categories have the largest median premium?
- Does the premium remain after discounts?
- Are price differences consistent across retailers?
- Which product groups have enough matched items to support a reliable comparison?
- Are there categories where the brand is consistently cheaper than competitors?
For real-world examples, compare Datahut's Nike vs Adidas competitive analysis with its Sephora vs Ulta Beauty analysis. Both examine differences in product ranges and pricing, but in very different retail categories. Use them as examples of category-level competitive research, not as proof that every observed price gap is caused by brand equity.
Frequently asked questions
What is the formula for brand price premium?
Subtract the benchmark price from the brand's price, divide the difference by the benchmark price, and multiply by 100.
Price premium (%) = ((Brand price − Benchmark price) ÷ Benchmark price) × 100
Why should products be matched before calculating a price premium?
Matching reduces distortions caused by differences in size, specifications, pack quantity, features, and product type. It makes the price comparison more meaningful.
What is the difference between premium pricing and price premium?
Premium pricing is a strategy in which a business sets prices at a relatively high level, often to support a particular market position. Price premium is the measured difference between a product's price and a defined benchmark.
Should I use average or median price premium?
Use both when possible. The average reflects the mean of the product-level premiums, while the median shows the middle result and is less affected by extreme values. Explain which measure you use when reporting results.
Does a high price premium prove that a brand is more valuable?
No. It shows that the brand is priced above the selected benchmark for the products analyzed. Customer willingness to pay, brand equity, perceived quality, and other factors require separate evidence.
How often should price premium be measured?
The frequency depends on how quickly prices and promotions change in your category. Fast-moving categories may need daily or more frequent monitoring, while slower-moving categories may need less frequent checks. Use a consistent schedule so you can compare results over time.
Measure brand price premium with comparable product data
A useful brand price premium analysis starts with reliable product matches. If the products aren't comparable, the calculation won't give you a dependable answer, regardless of how precise the formula looks.
Build the comparison around equivalent products, consistent price definitions, and category-level results. Keep average and median premiums separate, account for promotions, and record the date of each observation.
Once those rules are in place, your team can use matched e-commerce products to benchmark competitors, spot differences in pricing strategy, and make better-informed decisions about where to compete on price.


